Unizin Reports
Winter 2023
This report is to be shared by design to communicate the full scope of Unizin impact, work products, and status at your institution.
T&L Advisory Retreat in Chicago in May
We’re excited to share that the spring Teaching & Learning Advisory Group meeting will be held at the Big Ten Center in Chicago — our first in-person meeting since 2019! We’re looking forward to sparking conversation and collaboration among colleagues and the opportunity to reconnect and network after an extended period of virtual interaction.
Our meeting will feature
- special topics introduced by the T&L subcommittee chairs and Unizin staff; and
- guest presenters who will share how they are leveraging data from the UDP at their institutions, followed by conversations about implementation strategies.
Meeting schedule (in Central Time)
Day 1: Thursday, May 4th (12:00 – 5:00 CT)
Day 2: Friday, May 5th (8:00 – 3:30 CT)
*The first hour of both days is for reconnecting over lunch and breakfast. Unizin will provide lunch on Thursday and Friday and breakfast on Friday. Dinner reservations at local restaurants will be made in advance; participants can opt-in and are responsible for this meal.
- Register now
- Reserve your room at the Aloft Hotel by April 5 to utilize the negotiated room rate.
Strategic Taskforce DataMarts - Level 2 & 3 Course and Program Next Steps
The Student Success Taskforces data marts providing “level 1” (student-level) data has been a central goal of DSS since the finalization of the five base dashboards and accompanying data marts. The mart_taskforce.level1_aggregated mart aggregates data about a student’s performance and activities in a course every week (see: https://resources.unizin.org/display/UDP/Taskforce+Mart+-+Level+1+Aggregated).
Over the late summer and early fall, Unizin worked with member institutions to deliver the institutionally specific marts in member production environments to begin use case testing. Colorado State was the first member institution to be provided access to the mart for investigation and feedback. As of September 1, when a mailing was sent out to members to promote the new DSS training/boot camp site and availability of the Task Forces data marts, several member schools have now requested access to the marts to test and provide feedback (the University of Michigan, University of Nebraska-Lincoln, University of Florida, and University of Wisconsin).
With helpful feedback from member institutions, Unizin Data Services and Solutions (DSS) is shifting focus to Level 2 and 3 data marts that aggregate Level 1 data at the course or program level, serving specifically broader student success and administrative teams at our member institutions. Again, these level 2 and level 3 marts are, in essence, an extension and solely dependent on the work DSS did in creating the Level 1 data marts, with tables that surface data aggregations at the course and program level based on the “grain” of the level 1 data marts.
Task force use cases, as you will recall, centered on understanding students, courses, and programs through the primary lens of capturing the critical activities of students in their courses comprehensively; using those activities to measure or construct models of engagement; and summarizing student, course, and program-level data in the form of aggregated profiles that provide richer contexts for students in a course, a course or selection of courses as a whole, or an entire degree program or collection of programs within, departments, schools or a college. What a faculty member might wish to understand about, for example, the distribution of majors in their course, a department head, dean, or advising team might want to see in aggregate majors across all courses and programs from the units they support, or to understand the migration of students within STEM disciplines, the time, frequency, and majors of students moving in and out of their program. These course and program aggregations thus extend to the overall schema DSS created for the Task Force level 1 aggregated mart, such as the number of submissions or late submissions, Frequency of discussions and length of those discussions, or student activity within the LMS in general reflected in file views and LMS session length. Thus, while the “grain” of the data for level 1 data provides richer contexts around individual students, level 2 and 3 data looks to surface potential trends in the course and program activity and performance, pointing to changes in course design and curriculum rather than the potential for richer and deeper student engagement and intervention.
The level 2 mart is ready for distribution and testing at a beta quality level. We are performing the rollout of this mart the same way as we did for the level 1 mart. If requested, DSS will create an institution-specific level 2 mart and place the tables in the mart_taskforce dataset in the corresponding tenant’s production BQ instance. The SLA for delivery of the mart following receipt of the request is 3 business days; please submit a JIRA ticket to our DSS team to request access to the level 2 mart! As we get feedback from users, the schema and fields may change, so please keep this in mind when leveraging this mart for production use cases.
Synthetic Data: Creating a Fully Anonymized Representation of UDP Data
Building tools and training that allow members to extract the most value from the UDP often rests on tangible examples of UDP exploration, such as Big Query tables and dashboards. These examples often involve sensitive, institutional data that is potentially PII, requiring institutional vetting of both the roles of those accessing the data and use cases. And while each member institution governs access and assessment of these use cases for their academic and institutional researchers, the challenge of representing aggregated data across the consortium, or introducing the UDP to prospective members, even if the data is anonymized, is largely constrained by the legitimate privacy and confidentiality concerns of member institutions. Representing learner and learning environment data at the consortium level, aggregated to remove individual, institutional representation, or using anonymized data from a member institution in a dashboard, implies a level of risk many, if not most, institutions are unwilling to take.
To address this challenge, Unizin has begun creating a “synthetic dataset” not from derived institutional learner and learning environment data but from the random generation of values broadly based on actual distributions of data represented in the UDP and Department of Education or Census Bureau data sources. In this way, we are not deriving data from the UDP to create synthetic data, but using the logical distribution of data on courses, assignments, and assessments, for example, as a range of data through which random values are generated, and in so doing, produce data that, while entirely fictitious, portrays data that aligns with rational and consistent trends in learners and learning behaviors.
There are two main stages to creating synthetic data. The first stage is defining the distributions of UDP data. To do this, we look at the individual distribution of a field of interest in each member institution’s context store data. Then, we union all these individual distributions to get the overall field distribution, regardless of institution. For example, one field whose distribution we want to define to create the synthetic data is the ‘role’ field in the ‘course_section_enrollment’ entity. To understand what the distribution of the ‘role’ field should look like in our synthetic ‘course_section_enrollment’ entity, we need to know the actual distribution of the field in the real entity. Therefore, we look at the number of entries associated with each value of the ‘role’ field for each institution’s data. To define the overall distribution of the field, we add up all entries associated with each value of the field across all institutions’ data and then divide that sum by the total number of entries across all values and institutions. This gives us the percentage of each value for the field across all institutions. For the ‘role’ example, a certain percentage would be defined for the value ‘Student’, another percentage would be defined for the value ‘Teacher,’ and so on. All the distributions employed to create the synthetic data are defined using SQL code, and the majority of the distributions are based on the context store data of all member institutions. The only exception to this is the distribution of the sex and race of students. These distributions are based on Census Bureau data instead since they include more sensitive information.
The second stage is the creation of synthetic data entities. Currently, we are planning to create eight synthetic data entities to represent eight entities in the UDP context store that were thought to be of most interest to users. These eight entities are ‘academic_term’, ‘course_grade’, ‘course_offering’, ‘course_section’, ‘course_section_enrollment’, ‘learner_activity’, ‘learner_activity_result’, and ‘person’. For each of these entities, we chose to recreate an assortment of essential fields from the original entity for the synthetic entity. Most of the values for these fields are randomly defined based on the distribution of the field in the UDP data defined in the previous stage. A simplified example of this process can be shown using the ‘role’ field again.
A good example would be if we found that 70% of ‘role’ entries across all institutions’ data were associated with the ‘Student’ value. Based on this distribution, an entry in the synthetic data representation of ‘course_section_enrollment’ would have a 70% chance of being defined as a ‘Student’ role. This random definition of fields is achieved using Python packages and functions; these synthetic data entities are created using Python code.
University of Michigan Data Anonymization Project
The University of Michigan Information Technology Services (ITS), Teaching and Learning team has partnered with its Dearborn Campus Data Science to investigate how Canvas tools are used, with the idea to both support the instructional design and provide tangible data with which Data Science graduate students can work. Key questions related to this inquiry were:
- How are students navigating a course, what is the frequency of their activity, and where do they spend most of their time?
- What is the overall usage of the tools in courses based on tool-launch metrics?
- How are faculty using modules, and are they using them to organize access to course content?
- Have they hidden other tool areas for students to access content via modules?
The time periods under investigation (Fall 2019, the fall semesters for 2020 and 2021, and Fall 2022) are chosen to better understand the behavior of students before, during, and after a period significantly impacted by Covid, examining a series of courses from the College of Engineering and School of Art and Design. How instructors employ modules and how they use modules to organize access to course content is also of interest.
As a foundation, this project drew on work completed by Unizin’s LMS and LTI tool launch data marts (see:https://resources.unizin.org/display/UDP/Data+marts).
However, for this project, the University of Michigan needed events from 2019 and 2020, which are not included in the original data marts, to reduce the cost of querying the marts for users. To make this adjustment, Data Services and Solutions reran the code for the LMS and LTI tool marts to include data from 1/1/2019 to the current date and saved the resulting marts as separate tables. These tables were then depersonalized, hashing person IDs and anonymizing names and email addresses. The final depersonalized tables were delivered and appropriately permissioned within a dedicated project folder.
This project underscores not only the importance of rich collaboration with members around institutionally driven use cases but the importance of DSS’s work supporting common themes of inquiry represented in the data marts created for both the base dashboards and the Task Force-driven priorities.
The University of Minnesota Ex Libris Leganto Project
Shane Nackerud and Kirsten Clark at the University of Minnesota, in addition to other member stakeholders and Unizin, have collaborated over the last several months with Ex Libris to deliver events generated through their Leganto (an LTI application within Canvas) reading list platform to the Unizin Data Platform (UDP). These events will reflect navigation to Leganto, reading list, item access, and whether or not the content was downloaded. In addition, Shane and Kirsten have worked to implement an opt-out feature for those students choosing not to have their behaviors used in future analytics.
Early this month, Kirsten activated events for courses with Leganto enabled, activating student-generated events to flow into the University of Minnesota’s production UDP tenant. Once University of Minnesota data steward approval is received, Unizin will convey a fully anonymized table of these events to Shane and Kirsten to allow them to assess the quality of events being sent to the UDP, and take that information back to Ex Libris for potential changes as we finalize this project.
All IDs for the table have been hashed, and all names have been anonymized in such a way as to preserve the “structural” integrity of each record but mask any way to connect back to a student, faculty member, or particular course.
This exciting development provides multiple use cases through which Unizin, in collaboration with members, build on existing services, including further refinement of our data anonymization or depersonalization process, expansion of content-driven tool data into the UDP, engagement with third-party vendors committed to data access through their platform; and exploration of various ways to address data privacy through an “opt-out” option.
New My Learning Analytics (MyLA) Release
Our colleagues at the University of Michigan collaborated with Unizin staff throughout 2022 on a version of MyLA that relies 100% on the Unizin Data Platform. MyLA was initially designed to work with Unizin Data Warehouse (UDW) data, a product that not all members have in place across the consortium. With the newest release, MyLA can be configured to run on either the UDW or the UDP. Unizin staff are in the final stage of testing the new MyLA release on our infrastructure and working with colleagues from the University of Wisconsin-Madison to pilot MyLA running entirely on the UDP this semester. If you are interested in piloting this new release of MyLA, please reach out to Bart Pursel.
The Unizin Customer Advisory Board Kickoff Meeting at Instructure HQ
In late 2022, Instructure invited Unizin to create a Customer Advisory Board (CAB) consisting of one representative from each Unizin member institution. On January 26th, the CAB held its first gathering in Salt Lake City at Instructure’s headquarters, where CAB members met with many of Instructure’s executive leadership team and members of product, support, and engineering teams. Instructure shared their vision for the company, particularly in the higher education space, and how their products take shape. Members of Unizin shared opportunities for collaboration and partnership, with the meeting ending with a shared vision for the CAB going forward built around the idea of partnerships.
“The site visit was great!” said Dave Long, Associate Director of Enterprise Instructional Technology at the University of Iowa. “I really appreciated the engagement and dialogue with Steve, Melissa, Shiren, and other leaders at Instructure. Strengthening our partnership and continuing to fine-tune our alignment in both strategy and operations will be mutually beneficial for Instructure and Unizin institutions.”
“We enjoyed having Unizin and the partner Institutions on site!”, said Libby Knott, Vice President of Customer Success Management. “It was a productive, collaborative day that further unified our partnership moving forward.”
Various takeaways from the CAB meeting include ongoing, quarterly meetings where the Unizin CAB can provide input on the prioritization of product enhancements and pathways for Unizin members to participate in future alpha and beta programs for upcoming product releases.
Instructure was one of Unizin’s first partners when the consortium was formed in 2014. At the time, Unizin was very much a non-profit startup, and Instructure was early in its rise to LMS dominance. In the first few years of the consortium, Unizin members had a very close, collaborative relationship with Instructure. The Unizin CAB meeting rekindled much of that same early energy, promising a renewed relationship built upon collaboration and partnership.
Digital Content Program Update
First, before the Summer and Fall ordering periods, Unizin revamped the search feature in the Unizin Order Tool. This improvement drastically improves the search results for keyword and title searches, making it easier for instructors and coordinators to find the content they have adopted.
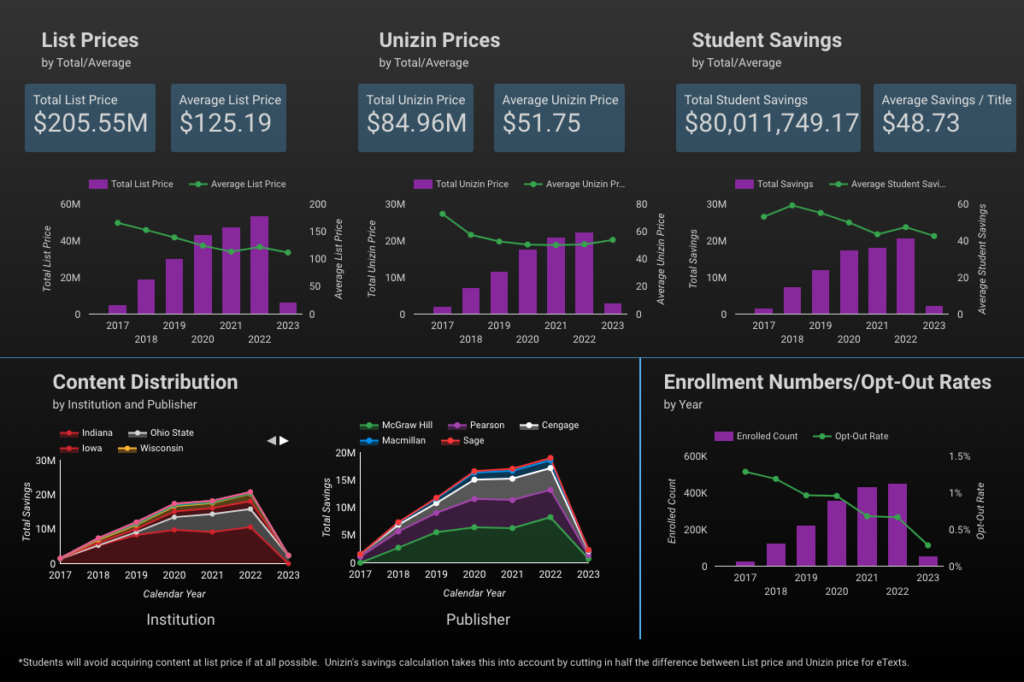
Second, Unizin staff completed the billing activities for the last of the Fall and Winter terms. As the calendar year closes, estimated student savings for 2022 exceeded $20 million for the first time in a single year. That’s an increase of over 14% from 2021. In addition, our student uptake rate continues to improve due to a continued decrease in students who opt out. In 2022, Unizin delivered content to 99.4% of the eligible students enrolled in the courses we serve. For comparison, typical update rates in other opt-out programs are in the 90-95% range.
Third, our colleagues at Indiana University have delivered digital content through the “All Students Acquire” model for longer than Unizin has been around and has been a pioneer in this space for over a decade. They recently crunched the numbers and announced that since 2010 through Fall 2022, IU students have saved over $100M! More impressively, in the Fall of 2022, IU eText reached more than 58% of IU’s students. Kudos to Mark Goodner, Noma Meier, and everyone at IU on this tremendous milestone.
Vendor Focus: Harmonize
Unizin and 42 Lines executed a partnership agreement in December. This agreement adds their product, Harmonize, to the roster of platforms and tools available to members through Unizin.
Harmonize is a learning tool in the discussion space focused on increasing engagement to promote active learning. Unizin will host an introduction webinar on March 24 for anyone interested in learning more about the product and how the University of Michigan is leveraging insights from the platform to increase social connections.