Unizin Reports
April 2021
This report is to be shared by design to communicate the full scope of Unizin impact, work products, and status at your institution.
Perspective: Unizin’s Guiding Principles for the Application of Learning Analytics
Beginning in June of 2020, a working group comprised of members from Oregon State University, The Ohio State University, University of Wisconsin, and University of Florida, began a working draft of Unizin’s Learning Analytic Guiding Principles. The goal was to produce consensus around ethical guidelines for applying and using learning analytics to inform member institutional policy. However the purpose is not to dictate how to use the principles operationally at each member institution. Unizin’s Board just approved these principles as is on May 6, 2021!
Kim Arnold (University of Wisconsin), Marcia Ham (The Ohio State University), Robin Pappas (Oregon State University), and Doug Johnson (University of Florida) were the key architects of these Principles, moving the drafts forward through revision and review by various Unizin stakeholders. At the Unizin 2021 Virtual Summit, Robin recalled that “Despite being all over the map in terms of data governance, politics, and history-shaping areas of emphasis in teaching and learning, and student support, and how those affect learning analytics, there was a lot we had in common in terms of a shared set of values, and a shared desire to articulate those share values at the consortium level.” The entire presentation and story of these Principles from the Summit are available.
An early draft was circulated to a representative group of researchers across all member institutions. Feedback was secured and incorporated into a draft revision in October 2020. Between October and December 2020, the Guiding Principles were presented to the Learning Analytics Subgroup, the Library Subgroup, the Teaching and Learning Advisory Group, and Unizin Legal Counsel. In December 2020, the Unizin Board reviewed the principles for the first time. In March 2021, both the Security and Privacy Committee and Unizin legal counsel reviewed the final draft of the LA Guiding Principles and approved its content. On the advice of legal counsel about the potential for outside parties to misinterpret guidelines and seek claims against Unizin or its members for implementing (or not) guidelines as practices, the Guiding Principles will not be posted publicly on the Unizin website. For more information about the LA Guiding Principles, please contact james.russell@unizin.org.
These principles express a shared commitment among members and Unizin of our ethical obligation to position learning analytics in a critical and mindful light. Therefore, these guidelines are aspirational, and function as guideposts within which member institutions can choose to develop and implement policy and governance around applied learning analytics in ways that incorporate the unique concerns of their respective institutions. In this light, the principles are helpful in the following contexts:
- The Guiding Principles can frame discussions and provide a roadmap toward local institutional implementation of Learning Analytics standards, best practices, and policy.
- It is a voluntary charge for member institutions to draw on and operationalize the Guiding Principles based on the institution’s unique concerns, policies, and culture.
- Unizin supports the core values of the Principles but does not mandate member institutions adopt them.
- Unizin’s philosophical agreement with the Guiding Principles extends to its commitment to support local implementation at member institutions through dialogue, discussion, and communication.
- Unizin will keep apprised of institutional applications of and use cases resulting from the Guiding Principles through Unizin appointed data stewards.
Unizin’s Principles set the stage in some productive and broader discussion of how security, confidentiality, privacy, and ethics inform at every level the services Unizin provides. Within the Unizin community, we look forward to these conversations and regard these principles as a living a breathing document.

James Russell
Senior Director of Research Support and Assurance
Engage eReader Replacement Taskforce
The Engage eReader Replacement Taskforce (EERT) completed its evaluation of three readers with the potential to replace the current Engage PDF and EPUB readers. The taskforce was charged with evaluating each reader on the merits of accessibility (based on feedback from users and support personnel) and usability (based on feedback from students, instructors, and support personnel), with accessibility considerations taking precedence over features.
In parallel, the Unizin team worked with the three vendors to unpack the technical requirements of potential integration and other potential opportunities for a deeper partnership. The EERT and the Unizin team both concur on which vendor to recommend, and with the Board’s consent, Unizin has begun discussions with the preferred vendor. The runner-up will remain in contention until it is clear that the negotiations will work out with the preferred provider.
Below is the tentative timeline for the delivery of a new reader experience in Engage. This timeline is admittedly aggressive and an optimistic best-case scenario. As Unizin’s technical team gets deeper into the weeds, a more specific scope will yield a firmer production delivery date. The final decision on when to time the production release will consider Unizin members’ needs to manage the change locally.
- Summer 2021 – contract negotiation
- Summer/Fall 2021 – technical implementation
- Fall 2021 – change management working group
- Fall 2021 – accessibility working group
- January 2022 – production release of the reader within the Engage bookshelf
LA Student Success (Fac/Stdts.) Taskforce
The taskforce defined three use cases after much deliberation. Unizin recommended the same three use cases for the following technical review phase and, ultimately, implementation. On May 6, the Unizin board approved these use cases with the caveat that the predictive and suggestive analytics were deferred for a future time. The use cases are:
- Impact of student activity.
- Student engagement as defined by frequency and duration of an activity.
- An aggregated group of use cases provide descriptive statistics on students’ demographics, prior preparation (pre-university), and prior performance (at university), both in general and in relation to academic performance.
Student activity metrics will likely include the following data points, subject to technical review and pilot planning. Use case 1 data:
- Level 1 = Student (I.e., assignments, participation, demographics, etc.): Privacy in play on faculty-facing dashboards, reports, analysis via data services.
- Level 2 = Course (I.e., assessment, quizzes, readings, navigation events, media interactions, accessing feedback) all within the relevance in relation to class cohort’s performance and outcomes. This level includes a student-facing component like MyLA or EoS (Elements of Success), faculty-facing data relative to student and course level. Lens’ of STEM, DEI, degree program, previous courses/student, etc.
- Level 3 = Program (I.e., a subset of courses or could be entire academic discipline) comparing metrics on outcomes, activities (within the term, prior term, and across instructors) to better understand student course and activities across disciplines (e.g., which assignment/s or activities within a course have a solid correlation to student success?)
- Level 4 = Suggestive and predictive analytics. This level will vary by institution and must be informed by applied research. Potential exists for proactive and reactive interventions. This possibility applies mainly to the course level application and data. Unizin should consider this a stretch goal.
Use Case 2, the data will seek to characterize students’ engagement in a course. Engagement is defined as metrics that describe the frequency and duration that a student spends on activities (i.e., assignments, reading material, quizzes, and content). From a data perspective, Use Case 2 builds on Use Case 1 naturally. These metrics will likely include the following data points, subject to technical review and pilot planning. Use Case 2 Data:
- Level 1 = Activity Type including but not limited to quizzes, discussions, content, sources. Lens’ include per person, per course. Metrics include time spent, # submitted/involved with, highest and lowest score, time spent in, most recent involvement/posting, duration, etc.
- Level 2 = Course Activity with a shift to the overall performance of a course and the content within that course. Metrics in Level 1 will be viewed against the distribution of student peers in the course to determine ahead/behind metrics relative to the course average. This level pivots on course structure and demographics. Lens’ include DEI, STEM, etc.
- Level 3 = Historical and comparative activity will identify periods of high historical activity in instructors’ current and past courses. How does this correlate with related students’ time spent? With performance? Identify these periods of high/low activity and outcomes for course adjustment considerations by instructors.
Use Case 3, course composition & descriptive statistics is an aggregated group of use cases. This group of use cases provides descriptive statistics on students’ demographics, prior preparation (pre-university), and prior performance (at university), both in general and in relation to academic performance. Faculty members and educational administrators will use this data. Potential uses include guiding students to appropriate campus resources, improving course materials and instructional approaches, redesigning a course, and revising an entire course sequence or curriculum.
This Use Case (3) has a design focus intended to promote equity in academic success by helping instructors tailor instructional approaches; course design (including texts, presentations, homework assignments, other assessments, etc.); and entire course sequences and curricula to students’ needs. These use cases support both short-term adjustments during a semester (e.g., replacing a key example in a presentation with a more culturally relevant model) and longer-term adjustments (e.g., replacing or substantially revising major assessments to provide students with multiple means of demonstrating their achievement of learning objectives). Further, these use cases support revisions to course sequences and programmatic curricula by providing historical and cross-course data for a program, major, or discipline.
Because Use Case 3 considers students’ performance on specific assessments within a course, it has significant overlap with Use Case 1 (I.e., Impact of student activity). However, while the first use case focuses primarily on assignments, this use case focus mainly on students’ demographics, prior preparation (pre-college), and prior performance (e.g., in post-secondary courses taken before the current semester).
The lenses of faculty, DEI, and STEM (and other meta-disciplines) inform the explanations of each level below for Use Case 3. The student lens is omitted for two reasons. First, we believe that the information provided on demographics and prior preparation will be useful for faculty and academic administrators but may be un-useful, at best, and potentially damaging, at worst, for students. Second, information on students’ performance will be provided through the first use case: Impact on Activity. Use case 3 assumes data from both prior use cases (1 & 2).
The data for Use Case 3 is organized into four levels:
- students’ demographics, prior preparation, and performance.
- course components analyzed by demographics, preparation, and performance.
- prior sections and other courses, analyzed by demographics, preparation, and performance.
- indicators/interventions by demographics, preparation, and performance.
For all three use cases, the methods of measuring success overlap but will vary. Hence listing them here would be lengthy and of little value at this stage. The next step is choosing the pilots. In collaboration with the chosen pilot institutions, technical requirements will inform a timeline of deliverables. Milestones will be iterative. Please keep in mind that the technical delivery of these data services is just one component of this project plan. Ethical considerations, cultural change strategies, professional development methodologies, content, and documentation must accompany all stages of this data delivery. Unizin’s T&L communities will need to coordinate to develop generalized change management, professional development, and documentation customized by each institution in a future rollout phase.
Unizin thanks its hard-working taskforce members: Gwen Gorzelsky – Colorado State, Ryan Yang – Florida, Jane Russell – Iowa, Heather Rypkema – Michigan, Chad Brassil – Nebraska, Lynn Greenough – Oregon State, and Ben Heller – Penn State
LA Student Success (Advisors) Taskforce
Advisors and student success staff (henceforth “success staff”) lack a complete view of a student’s academic experience. It is challenging, for example, for success staff to determine if a student is engaging or disengaging from a course. Success staff also struggle to situate a student’s performance in a course within their broader academic journey (e.g., overall course load, the path to a degree, etc.). Additionally, there’s no consensus on a reliable set of leading or trailing indicators or alerting metrics that success staff can depend on to decide when and how to conduct student outreach and intervention.
A complete, cohesive data portrait of a student’s academic experience is a shared element of any solution to these problems. The main challenge in developing a solution is determining how to define the particular representations of the student experience to incorporate into success staff practices. A validated, prioritized set of use-cases for success staff advising practices can help clarify how to begin solving the problem. Student success staff may also face a data literacy challenge. To incorporate new data into their workflows and judgments, success staff will need to be trained on interpreting data culled from the learning environment.
The taskforce developed the following use-cases to refine its definitions of the core problem to solve. These use-cases do not yet represent a prioritization. This all-encompassing summary was derived from the following explored use cases:
- Success staff must, at times, depend on a broad, potentially diverse, set of raw data to properly inform decisions about how best to serve students (descriptive data).
- Success staff must interpret the meaning of data that informs their judgments (data literacy/dictionary).
- Success staff must confidently identify disengaged students and conduct a proper, informed intervention to address the student’s disengagement (indicators).
- Success staff benefit from the classification of student needs into routine cases where prescriptive actions are recommended (prescriptive data).
- Success staff must anticipate or predict where students may fail to succeed, engage, persist, or be retained term-over-term in their online programs (predictive analytics).
The taskforce suggests that many of these use cases could be addressed by collecting and computing a range of descriptive metrics and analytics. These descriptive metrics are the basis to meet all of the use cases described above.
- Course-level student performance data. Over and above raw learning data, which can be cumbersome to explore, the taskforce recognizes that course-level aggregations of a student’s performance are a baseline to all of the use-cases described above. The taskforce recommends that Unizin focuses on in-course learning activity data, such as quiz performance, assignment performance, discussion interactions, and learning tool use that is aggregated into a set of summary metrics for the course. Additionally, it is recommended that Unizin compute metrics derived from behavioral data, such as time-on-task/dwell-time metrics, at the course level.
- Course-level student population data. The taskforce recommends that Unizin develop student population metrics for each of its course-level student population metrics. Doing so will enable comparisons between students and peers that can contextualize the meaning of an individual student’s performance. By “population metric,” it is meant as a mean, standard deviation, and other common metrics to situate an individual on a distribution. The taskforce also recommends that Unizin generate temporal descriptive statistics for individuals in relation to their peers. By “temporal,” it is meant that Unizin would capture the data mentioned above at regular intervals, enabling individual performance and population performance over time.
- Indicators. As a stretch goal, and in concert with member advisors, the taskforce recommends that Unizin explore computing “risk indicators” for a student in a term. The substance of these indicators is up for future consideration. The key idea is that high-level metrics tied to a particular kind of risk or intervention are produced out-of-the-box by Unizin. It is not recommended that Unizin generate prescriptive metrics. Instead, the indicators are intended to capture a high-level state of a student in a course (e.g., engagement).
Measurements of success may include:
- Quantitative surveys of success staff perceptions of learning data/analytics value.
- Comparative studies of student outcomes (grades, completion, etc.) whose advisors use learning data/analytics and those who do not.
- Coded qualitative interviews with success staff about the use of learning data and analytics in their everyday practice.
- Instrumentation and measurement of the use of learning data and analytics in the end-user advising tools.
Serious and intentional work must be done regarding the ethical use of these data services. Considerations should include the timing of class-level student demographic information (E.g., Upon term completion), not releasing any demographic information at all and whether instructor-facing data should be identifiable per individual student regarding interactions with content. Additional awareness and pre-planning must consider the potential comparison of faculty with ramifications on minority status, academic rank, etc. Institutions that use this model to support academic program reviews will need to follow best practices to conduct ethical and inclusive program reviews.
The taskforce recommends that Unizin consider the novelty to success staff using LMS data in their practices. Institutions will need to train success staff to understand the value and the limits of learning data in decision-making. To this end, the taskforce recommends that Unizin’s Professional Development T&L community develop training strategies and resources for end-users, including but not limited to:
- Unizin provides data definitions and use case example documentation and recommendations.
- Unizin’s Learning Analytics Teaching and Learning community develop impact assessments of increased data access on staff.
- Unizin consider establishing a Teaching and Learning community for success staff and focus initially on identifying best practices on how to use the data in scenarios/academic support positions.
- Unizin provide of how LMS data is successfully connected to student support/advising efforts should be developed to help end-users identify the value add.
For Unizin to serve these use cases well in varied institutional contexts, there are a few implementation considerations of note:
- Every Unizin member will come to the table with distinct advising communities, each of which may be using various advising tools. There is unlikely to be a standardized method to integrate learning data into a generic advising tool. Consequently, it will be up to each institution to build the “last mile” of data integrations between Unizin’s data services and its success community’s tools (e.g., Starfish, OnCourse, Elevate, etc.)
- As Unizin rolls out its data services, it should consider each institution’s onboarding and adoption challenges. One method of lowering the overall costs of onboarding members is to facilitate institutional knowledge sharing, support, and development via events like bootcamps, hackathons, and working groups. Unizin might also consider building out prototype solutions that leverage underlying data services to demonstrate how they can address a use case.
- Unizin should consider writing documentation and user guides that enable success staff to understand, interpret, and use learning data.
- Finally, a stretch goal is for an institution to volunteer to build a dashboard or lightweight app used by success staff to use learning data in their everyday work. The dashboard or app could be used by design across the consortium since the underlying data is sourced from the UDP.
Thank you to the taskforce members and those from their institutions who provided essential feedback: Matt Anson – Iowa, Ryan Baltrip – Miami of OH, Sean DeMonner – Michigan, Bill Watts – Nebraska, Cory Tressler – Ohio State, Drew Wham – Penn State, and Kim Arnold – Wisconsin.
Research & Innovation
Unizin Sponsored Research – Impact of Digital Learning Interactions in STEM Education
Reporting: Tracie Reding, University of Nebraska, Omaha
The Unizin-sponsored research grant (June 2020) titled “Impact of Digital Learning Interactions in STEM Education” funded the development of an algorithm used as a “proof of concept” for a proposed NSF IUSE project. The Unizin Project used the Communities of Inquiry (COI) framework (Garrison et al., 1999) as the basis for examining the interplay between instructor and student presence within the remote learning format and student outcomes during the anthropogenic disaster of the coronavirus pandemic (COVID-19). Data were obtained from 10 University of Nebraska Lincoln STEM-based courses. This project examined the influence that instructor and student network positions (i.e., student to student, student to instructor) within the STEM courses forced to transition to remote learning formats mid-semester had on student outcomes and interactions.
The purpose of this grant and the subsequent study was to develop an algorithm that can be used to pull learning analytics from the Unizin Data Platform to analyze the role of instructor and student network positions on various student outcomes using an extensive data set. The results could be generalizable. In general, using the data available to the researchers, there were no relationships found between instructor or student network position and retention in courses or enrollment in future STEM courses. There were no relationships found between a semester of delivery and relative course grade, retention in courses, or enrollment in future STEM courses; however, there were significant findings regarding student and instructor activity within the discussion boards and the student outcome relative to course grade, as well as substantial results regarding semester of delivery and LMS engagement and student network positions.
When examining differences between semesters, students in the Spring 2020 courses demonstrated increased LMS engagement compared to their counterparts in the Fall of 2019. It is possible that this increase in LMS engagement is due to the disruption in learning caused by the pandemic-forced remote learning. Interestingly, there were significant findings regarding student network positions that differed between the Fall 2019 and Spring 2020 semesters at all levels of analysis, notably Closeness Centrality. Upon further examination, during the Fall 2019 courses, 38% of students were in the top two quartiles compared to 48% during the Spring of 2020 courses. This increase in Closeness Centrality could be attributed to the disruption of daily life during the forced remote learning context created by Covid-19, where students were more willing to directly communicate with a diverse set of peers through discussion boards; however, no analysis was included in this study to account for that possibility.
There are plans to continue this research using the now-available University of Nebraska – Omaha (UNO) data to provide a larger dataset. Additionally, there are further plans to extend this theoretical framework into a future grant. This future grant will focus on the Top Hat platform, a much more robust study using data from multiple institutions, student demographics, and qualitative methods such as interviews of faculty members use Top Hat. (Please note that the Top Hat and Unizin co-sponsored research has yet to be awarded).
Currently, this study, “Impact of Digital Learning Interactions in STEM Education,” has collaborated with partners from Colorado State University (i.e., Dr. James Folkestad) and Indiana University at Indianapolis (i.e., Dr. Kyle Jones) and submitted a multi-institutional collaborative NSF grant proposal, which, unfortunately, did not get funded. However, there are plans to revisit the proposal this summer to see if it can be improved and re-submitted in the future.
The most significant insight from this study is for Unizin to address the demand for more accessible data sharing among the institutions. Unizin’s Research Advisory Committee has begun this work through the new Cross-Institutional Research governance process; and will look to the upcoming Unizin/Top Hat sponsored research proposal for process piloting. This project is not complete yet as Dr. Tracie Reding plans to combine data from UNO and rerun the analyses with a larger dataset. Stay tuned.
Research Support
-
Deidentified/depersonalized dataset provided to the University of Michigan’s “2021 Virtual Hacks with Friends” Event.
On the first three Fridays in May, the “Hacks With Friends” (HWF) event draws IT professionals from across the University of Michigan campuses, schools, colleges, and departments. HWF’s purpose is to solve problems and address current IT and data-driven challenges around such topics as HIPAA-compliant chat, workflows in Salesforce, Denodo for report building, and automating processes for refreshing data.
For an upcoming May HWF, Unizin Data Services provided a de-identified/depersonalized data set derived from University of Michigan data based on a previous data structure used by Unizin to deliver UDP Bootcamps. This dataset generation also served as the impetus to formalize governance behind data access broadly regarding the delivery of institutional data. As a direct result, Unizin added some critical steps to process documentation, including isolation of depersonalized data from other projects and applying duration of access for all depersonalized data. Finally, based on a discussion with the University of Michigan, there evolved exploration into various approaches to redacting data – including randomly generated values that provide alternative ways of maintaining the completeness of records while removing names.
Unizin Data Services 2.0 Expands
As Unizin’s support for institutional and academic research matures, Unizin’s Data Services is taking the next steps in meeting the needs and challenges of Unizin member institutions. The gap between drawing on the rich “candy store” of data (to quote Dr. Ben Motz of Indiana University) that is the UDP and information products supporting cross-institutional research or institutional intelligence has begun to close; and in so doing, signals the exciting growth demand facing Unizin Data Services.
This second phase defines more clearly the strategic and operational focus that is taking place. This focus begins with adding a new Data Analyst position to the Unizin team. With over 260 applicants and counting, the search will focus on shifting much of the operational duties from Kyle Unruh to the new position. This will allow Kyle to focus strategically on building multipurpose data marts; generalizing a specific project to work across the UDP; identifying gaps in the Unizin Common Data Model (UCDM); further refining our onboarding materials so that institutions – current and future – have the foundational information they need to begin utilizing the UDP; designing boot camps and hackathons that meet specific institutional research needs; and project management for research projects. This new Data Analyst position will primarily focus on refreshing existing data for current projects; configuring Google Cloud Platform environments and data for new projects; dashboard mockups and POCs; working with institutions on immediate questions around data or projects; troubleshooting data inconsistencies on a project-by-project basis; running boot camps and hackathons; and onboarding members.
As Unizin increasingly sees a need to proactively create proposed data marts that address common research questions and inquiry, the related demand increases to envision dashboards that provide insights to our member institutions. The power of UDP is brought to life through the visualization of use cases and the transformation of data into information. Unizin Data Services 2.0 empowers that success. Future growth is likely.
Unizin Data Platform
Significant Changes: The University of Michigan-Dearborn went into Production in early May. At this point, only one institution has not yet gone into Production with their UDP.
|
Institution |
Status |
Change |
|
University of Michigan-Dearborn |
Production |
UMD has completed its UDP implementation and now has data automated in Production. Unizin will work next on integrating Kaltura data for UMD in Production. |
|
University of Minnesota |
Production |
UMN is in Production. UMN now plans to work on updating SIS data entities to address referential integrity issues. Re-validation of these updates in SIT needs to be done before they can be promoted to Production. |
|
University of Missouri System |
Production |
Missouri is in Production. The next step is to test multi-SIS data loads within a 24-hour timeframe in Missouri’s UDP SIT tenant. Together times of day will be coordinated based on which times of the day Missouri wants to cut and push new data to the UDP and attempt to run cron jobs to catch the imports. |
No changes: University of Florida, Colorado State University, University of Iowa, Miami-Ohio University, University of Michigan, University of Nebraska-Lincoln, the Ohio State University, Oregon State University, Penn State University, Rutgers University, University of Wisconsin-Madison, University of Nebraska-Omaha.
Unizin Product Releases
Minor UDP release: The UDP now supports Instructure Canvas’s HTTP-based method to integrate Canvas Live Events. This method is preferred because it supports a “retry” function on events if they fail to be caught by the UDP, enabling greater fidelity in overall data transmission. Unizin was helping institutions move over to this preferred method of integration of Canvas Live events.
Two Minor Releases: The first introduces enhancements into the ordering experience for faculty, program admins, and instructors. Specifically, Unizin has updated the presentation and filtering capabilities of courses available for order so that users can quickly identify new courses that need to place an order. The second release improves the reliability and contents of email receipts to enrich the user experience.
Marketing
April was Summit month, and Unizin marketing took advantage of the excitement. As a result of the Summit activity, Unizin realized:
- Enriched social media presence. Primarily working in our Unizin LinkedIn and Twitter channels, the Unizin 2021 Virtual Summit was promoted and, as a result, gained Unizin subscribers. Web traffic to unizin.org is also vaulted.
- Increased original content. In coordination with TopHat, Unizin has developed an article offered to media outlets on data, standards, and learning analytics. If a media outlet is not identified, then we’ll self-publish.
With the Summit behind us, Unizin’s next marketing initiative steps fall into two major buckets. First, Unizin is focusing exclusively on generating original content for the website. Second, Unizin will soon be rolling out our new logo and brand across our media properties and collateral.
Summit
Unizin’s pandemic-inspired, first-ever virtual Summit was a resounding success. It enabled the Unizin community to extend awareness to over 500 attendees from 28 states and eight countries from 63 different higher education institutions. Additionally, two-member institutions sent over eighty participants each. No session “rooms” were closed due to seating capacity. 😉 All Unizin Summit 2021 sessions are available on YouTube with just two exceptions with private content. Catch up on the sessions you missed, or browse the top-10 sessions below for your edification. Enjoy!
|
Unizin Summit 2021 Top 10 Sessions! |
|
|
Title of Session |
Participants |
|
Keynote: The Student Experience is Greater than the Sum of Your Data |
272 |
|
Learning (Analytics) is Not a Spectator Sport |
172 |
|
Canvas Roadmap: 2021 and Beyond |
136 |
|
Modeling Student Success based on digital activity |
104 |
|
Innovations in Student-Facing Learning Analytics |
88 |
|
Inclusivity in College: Strategies for Supporting Diverse Learners |
59 |
|
Investigating self-regulated learners: Leveraging UDP data to measure changes in academic behaviors |
56 |
|
Not so dicey: Get rolling with research using the Unizin Data Platform |
56 |
|
ManyClasses 1: An Unprecedented Learning Experiment – Findings, Lessons Learned, and Looking Ahead |
48 |
|
How Usable is Canvas? Leveraging the Power of Unizin to Advocate for Improvement |
46 |
|
Overall, how would you rate the Unizin Summit? |
||
|
Poor |
0% |
Average 4.21 on 5-point Leichter Scale. 5 = Highest
Response rate low (34 total). |
|
Fair |
3% |
|
|
Good |
9% |
|
|
Very Good |
53% |
|
|
Excellent |
35% |
|
|
The Unizin Summit was valuable and worth my time? |
||
|
Strongly Disagree |
1% |
Response Rate is low (32 total). |
|
Disagree |
0% |
|
|
Neither Agree Nor Disagree |
6% |
|
|
Agree |
41% |
|
|
Strongly Agree |
50% |
|
TurnitIn
Conversations to renew Unizin’s distribution agreement with Turnitin that expires at the end of June are underway. This negotiation began in January 2020. This renewal will update the Feedback Studio/Originality pricing terms as it expands Unizin’s portfolio by adding terms for GradeScope and iThenticate. Unizin and TII agreed on enterprise adoption of GradeScope, and those terms were sent out to members on May 10. The remaining pricing terms will be communicated just as soon as both parties confirm them.
Leaving the Brazos Office
Bitter and sweet. Those are the words to describe the move out of our space on Brazos Street. An email was sent to notify the staff that the office would be closed permanently by the end of April. All staff was advised to come in and retrieve items they could use in their home offices. On Friday of that week, everyone who lives in Austin showed up at the office. It was a “sweet” moment. The team was so excited to see each other, even if it included masks with social distancing guidelines followed.
The bitter moment was realizing that we had three years of paper files that needed to be digitalized. After many hours of scanning, uploading, and shredding, it was determined that the paper should be delivered to a shredding company. That total remaining paper to shred weighed 70 pounds!
The lease termination will enable Unizin to save $70K in rent costs across the next two years. Closing the door to space on April 29 came with mixed emotions. Change brings new opportunities, as does remote work. Onward!
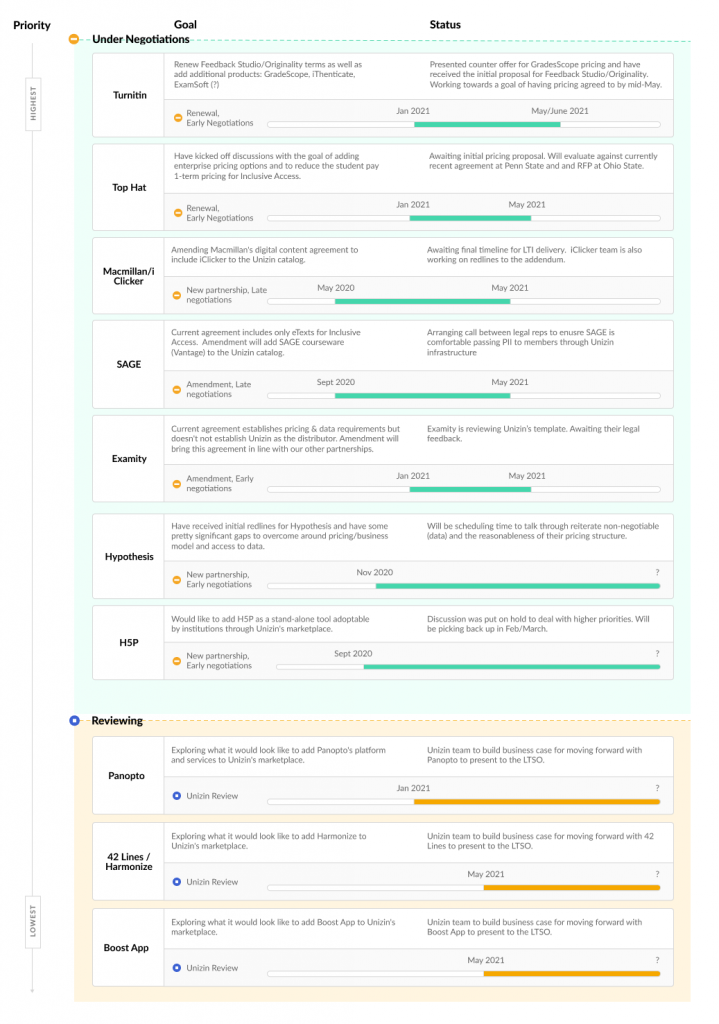
Vendor Partnership Timeline
The month of April saw significant movement on several inflight vendors. Along with the progress with Turnitin, Unizin is closing in on completed terms with Sage Publishing to add their courseware platform and have made significant progress with Examity to add reseller terms to their existing agreement. Unizin has begun reviewing two new vendors to potentially recommend moving forward with: Harmonize from 42 Lines and Boost App.