
Canvas Activity Score
A Simple Metric to Support Proactive Advising
“The Canvas Activity Score fills a critical gap by providing a trusted, scalable tool to support proactive advising strategies and complement the expertise of academic advisors. Its simplicity and transparency make it useful and easy to adopt. Working with Unizin, we’re excited to offer this tool broadly through a shared datamart.”
– Matthew Rust,
Associate Vice President, Student Navigation and Support,
Indiana University
Building a Better Model
Learning Management Systems generate vast amounts of student activity data. In fact, one Unizin member campus recently reported processing 2.65 billion student events into the Unizin Data Platform in 2024 alone. Aggregating and synthesizing this sea of data to provide predictive insights regarding student performance represents a massive opportunity for higher education. And it presents a host of obstacles.
Like many institutions, Indiana University spent considerable resources piloting a third-party predictive analytics platform with the intent to help advisors identify academically at-risk students to intervene more effectively. However, the opaqueness of the platform led to skepticism and low adoption among advisors and the robotic nature of the output proved difficult to integrate into the advisor-student dynamic.
The Unizin Data Platform provided the foundation for IU to investigate an alternative approach prioritizing transparency and actionable insights. Led by Matthew Rust, previously on the Indianapolis campus and now serving in the university-wide role of Associate Vice President of Student Navigation and Support, the IU team developed and validated a simple analytic to predict student success, then conducted a randomized experiment on the Indianapolis campus to directly assess whether integrating this analytic into a proactive advising model could improve student outcomes.
Scoring on Both Fronts
The Canvas Activity Score developed at IU used just three variables – assignments submitted across all Canvas courses, total assignments due across all Canvas courses, and non-idle minutes in Canvas during a designated interval – to predict student learning outcomes. These variables were selected because of their demonstrated predictive value and because they are easy for advisors to understand.
The IU team has released insights from two companion studies to analyze the utility of the Canvas Activity Score. The first was an initial assessment of the Canvas Activity Score that showed it was not only a valid predictor of end of term grades but also provided predictive insights beyond those of faculty’s manually submitted observations.
The second study assessed the impact of integrating the Canvas Activity Score into the university’s proactive advising toolbox by comparing a randomized treatment group to a control cohort of students. Analysis suggested that outreach by advisors to the treatment group led to a substantial increase in assignment submissions and active minutes in Canvas. The treatment group also achieved higher in-term GPA, saw a significant reduction in DFWs and had an 80% increase in the odds of persisting to the next semester compared to the control group.
The preprint manuscript describing both studies, coauthored by Rust and Benjamin Motz, can be found here.
The initial development and evaluation of the Canvas Activity Score at IU revealed three important insights.
- Simplicity is powerful: The Canvas Activity Score was effective because it used a simple, easy-to-understand model with just a few key variables – assignment submission rates and time in Canvas. This simplicity helped build trust among advisors who had been skeptical of the previous “black box” predictive model.
- Complementing, not replacing, existing advising methods: The Canvas Activity Score was not intended to replace other advising tools like faculty-submitted early alerts, but rather to complement them. By providing a more comprehensive and scalable early warning system, the score enhanced advisors’ ability to identify and support at-risk students.
- Maintaining the human element in advising: The Canvas Activity Score provided valuable data-driven directional insights on student risk while advisors maintained their personalized, coaching-based approach to support students. Ensuring the tool respected advisors’ professional judgment and did not oversimplify complex student behaviors or overpromise predictive capabilities was crucial for building trust and adoption.
Improvements, Insights and Expansion
Continuing to iterate, Rust and colleagues in the IU Office of the Vice President for Student Success have modified the underlying data sets to improve the Score’s precision, including using an aggregated course-normed score rather than a school-based norm, adding a new variable of total Canvas logins, and prioritizing assignment submission rate as the strongest predictor of student outcomes.
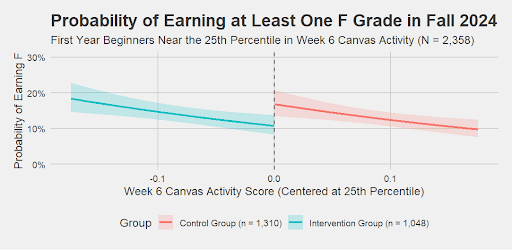
In Fall 2024, IU implemented a university-wide email nudge and advising alert campaign based on the refined Canvas Activity Score. The intervention focused on the least active quartile of first-year beginner students across all of IU’s nine campuses. Initial analyses from a regression discontinuity study reveal that these interventions significantly reduced the proportion of students earning F grades compared to non-alerted peers.
Given the predictive value of Canvas activity and engagement, the IU Student Success team is now exploring connections between these predictive analytics and course design. Partnering with Anne Leftwich, IU Associate Vice President for Learning Technologies, the team is exploring faculty development to make course sites easier for students to navigate. Together they will examine whether student success or satisfaction can be improved when faculty take steps such as:
- Ensuring assignment deadlines are clearly specified and up-to-date in Canvas. This design feature is sometimes overlooked when faculty copy over old course sites without updating assignment due dates.
- Encouraging more assignments and activities to be submitted through Canvas. Given the predictive value of assignment submission rates, working with faculty to move more course work submissions into the LMS might boost the predictive accuracy of Canvas-based analytics, which in turn can be used to improve student success.
- Providing more templates for Canvas course sites. Faculty already have a lot on their plates before having to think through the most student-friendly ways to organize Canvas course site layouts. IU’s learning technology unit has been piloting standardized templates with IU Online course faculty to lessen that burden and improve the student navigation experience.
Proliferating the Score Across the Consortium
Beyond IU, Unizin members can build their own applications and analytics tools utilizing the Canvas Activity Score data mart. The Unizin Student Activity Score data marts (mart_student_activity_score) enable any member to immediately apply the model without having to recreate the work already done by the team at IU.
The availability of the Student Activity Score data marts represent one of the major goals of the consortium: having members build and share useful applications and analytics that leverage the common data platform.
Image created with the help of AI using Canva.